This site is being phased out.
Report generation
The report is produced based entirely on the data in Pixcavator's output table, which contains all objects in the image satisfying the analysis settings. The table, combined with the settings, statistical summary etc, can be saved to hard disk in the form of a spreadsheet. The result is a complete report of the image analysis.
The statistics in the report comes from formulas that are fully editable. This gives the user a starting point for further data analysis.
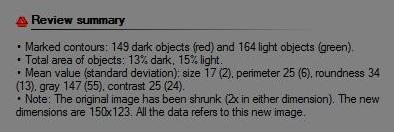
The structure of the report is illustrated by analyzing the image on the right (the original analysis is here). Below are the screenshot of the Pixcavator's output and the screenshot of the Excel file produced from the analysis (mimic, as much as possible, the way the Output tab looks):
The parts of the report are explained below.
The heading
The heading contains the text: "This report was generated by Pixcavator x.x for the image file: xxxx.xxx" followed by the scaling factor and the chosen color channel. This data comes from Pixcavator's Analysis tab.
The settings
The six numbers in the same arrangement as is the Adjust analysis settings section of Pixcavator's Output tab.
The data
This part is copied from the output table (List of objects) in Pixcavator's Output tab, but only the marked rows. The columns are the same:
- ID: the ID number of the object, in the order in which they are found (no special meaning),
- Type: L for light or D for dark, see Objects in gray scale images,
- LocationX and LocationY: the coordinates of the centroid of the object,
- Size: the number of pixels inside the contour of the object = area,
- Perim.: the perimeter of the object = the length of the contour,
- Round.: the roundness of the object,
- Gray: the average gray level inside the contour = average intensity,
- Contrast: the average contrast of what's inside the contour relative to the border,
- Thick. and Length: the dimensions of the object = thickness and length,
- ID: repeated for your convenience.
The rows correspond to the objects found in the image. The number of rows is currently limited to 2000.
The summary
Essentially the same information as in the Review section of Pixcavator's Output tab. For each of the 8 measurements you have the mean and the standard deviation displayed.
Keep in mind that depending on your Excel settings you may see only the formulas as they are entered instead of the numerical data that results from those formulas. For example, you see "=AVERAGE(E:E)" instead of "79.28". If this is the case, you will have to "confirm" each column, one by one, as follows:
 Mark the column, the click:
 Data -> Text to columns -> Next -> Next -> Finish.
You have to do that with all columns, even ones without formulas (data on the left).
The distributions
In this section the frequencies of values in each column are displayed. They show how evenly or unevenly the values are distributed. For example, the numbers in the second and third columns refer to the locations of the particles within the image. They indicate the the particles are evenly distributed. The next column refers to the sizes of the particles. These numbers indicate the sizes don't vary a lot.
The spreadsheet automatically creates 10 bins for each of the 8 measurements. Then, each entry shows how many values in the column of data on the left fall inside each of the bins.
The bins are defined by simply dividing the interval between the smallest and the largest values in the column into 10 intervals of equal length. The user can changes them arbitrarily; they are displayed below the distributions.
The frequencies allow one to create a histogram for each column to graphically illustrate the distributions. One can also add images to the report, format the text and numbers, etc. The end result may look like this:
Download the spreadsheet.
For examples of how the table and the spreadsheet can be used, see Image statistics.


