This site is being phased out.
Objects and holes
Topology of images
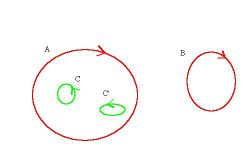
In a binary image, topological analysis is simple. Two objects and the first one with two holes:
With a gray scale image we need to threshold it first.
- The connected components of the lower level sets of the gray scale function are the “objects”.
- The connected components of upper level sets are the “holes”.
Of course, you can choose the opposite..
Below, an image and three examples of its possible topologies.
Which one is "true" is unknown. But at least we need to capture all of them. The topology graph provides the hierarchy of the objects and holes.
A similar definition is available for color images. It is based the partial order of the color space.
Outline of the algorithm
All pixels in the image are ordered according to the gray level.
- Following this order, each pixel is processed:
- add its vertices, except for those already present as parts of other pixels;
- add its edges, except for those already present as parts of other pixels;
- add the face of the pixel.
- At every step, the graph is given a new node and arrows to represent the merging and the splitting of the cycles:
- adding a new vertex creates a new object;
- adding a new edge may connect two objects, or create, or split a hole;
- adding the face eliminates the hole.
Cases to consider
- Case (a) - the new edge connects two different 0-cycles.
- Case (b) - the new edge connects a 0-cycle to itself.
- Case (c) - the new edge connects a 1-cycle to itself.
- Case (d) - the new edge connects a 1-cycle to a 0-cycle (inside).
See also Stages of analysis.


