This site is being phased out.
A graph, non-tree representation of the topology of a gray scale image by Saveliev
Contents
- 1 Outline
- 2 INTRODUCTION
- 3 THE TOPOLOGY OF A BINARY IMAGE
- 4 CELL DECOMPOSITION OF BINARY IMAGES
- 5 USING CYCLES TO CAPTURE TOPOLOGICAL FEATURES IN BINARY IMAGES
- 6 A GRAPH REPRESENTATION OF THE TOPOLOGY OF A BINARY IMAGE
- 7 THE TOPOLOGY OF A GRAY SCALE IMAGE
- 8 A GRAPH REPRESENTATION OF THE TOPOLOGY OF A GRAY SCALE IMAGE
- 9 COMPARISON TO TREE REPRESENTATIONS
- 10 COMPLEXITY OF THE ALGORITHM
- 11 EXPERIMENTS
- 12 REFERENCES
Outline
We provide a method of graph representation of the topology of gray scale images. For binary images, it is generally recognized that not only connected components must be captured, but also the holes. For gray scale images, there are two kinds of “connected components” – dark regions surrounded by lighter areas and light regions surrounded by darker areas. These regions are the lower and upper level sets of the gray level function, respectively. The proposed method represents the hierarchy of these sets, and the topology of the image, by means of a graph. This graph contains the well-known inclusion trees, but it is not a tree in general. Two standard topological tools are used. The first tool is cell decomposition: the image is represented as a combination of pixels as well as edges and vertices. The second tool is cycles: both the connected components and the holes are captured by circular sequences of edges.
INTRODUCTION
One of the main approaches to segmentation of gray scale images relies on capturing upper and lower level sets of the gray level function of the image. The rationale for this approach is that the connected components of these sets are arguably building blocks of real items depicted in the image.
The connected components of the upper level sets have also a clear hierarchy based on inclusion. This hierarchy provides a graph representation of the topology of the image. It is called the inclusion tree. Various approaches to the inclusion tree have been proposed and efficient algorithms have been developed, [1], [14], [17], [18], [19] and many others.
The connected components of lower level sets may be objects and the connected components of upper level sets may be holes in these objects, or vice versa. Meanwhile, the inclusion trees for upper and lower level sets, if considered separately, do not help in finding out which object has which hole. Therefore, in order to capture the topology of the image, the two trees have to be combined in some way. Approaches to such a representation are proposed in [1], [17]. However, these representations are trees. As a result, the lower level sets are mixed with the upper level sets and so are the gray levels.
We follow the lower/upper level set approach to the graph representation of the topology of gray scale images but also put forward a non-tree graph representation presented in [21]. We call it the topology graph. The topology graph contains complete copies of the upper and lower level inclusion trees but is free from the drawbacks of other combined tree representations.
Another goal is to design an algorithm that is both easy to understand and sufficiently fast. The topology graph is built via a “naïve” level-by-level construction algorithm that simultaneously captures both lower and upper level sets in a single sweep.
We justify our approach by appealing to classical mathematics. The background in topology as it applies to analysis of binary images is discussed below. Some background for two standard topological tools is also provided. The first tool is cell decomposition: The image is represented as a combination of pixels as well as edges and vertices. The second tool is cycles. Both the connected components and the holes are captured by circular sequences of edges. The data structure – the topology graph – for the hierarchy of objects and holes is provided. The algorithm for the construction of the topology graph is incremental – every time a pixel is added, the topology of the resulting binary image is re-computed.
The justification for the proposed approach to the topology of gray scale images relies on both the analysis of binary images and prior research. The graph representation of the topology – the topology graph – of a gray scale image is constructed incrementally as we go through the sequence of gray scale thresholds. The analysis algorithm also includes filtering of the topology graph. A comparison of the topology graph to the inclusion tree, especially the version presented in [17], shows certain advantages. An example is given of an image the topology graph of which is not a tree.
Implementation issues, such as the complexity (quadratic), memory requirements (linear), and processing time of the algorithm (40 seconds per 1 million pixels) are also discussed. The conclusion reached is that the algorithm is practical. The algorithm has been tested and the results have been shown to be reasonably stable under noise and other image modifications. Further research directions are: color images, video, and morphology.
THE TOPOLOGY OF A BINARY IMAGE
To justify our approach to gray scale images, we will start our analysis with topology of binary images. The reason for this approach is that in the beginning it is preferable to deal with topological issues in the simplest possible setting. These issues have been studied since Poincaré [8] and they are well understood.
All the background can be found in [12] (see also Introductory algebraic topology: course). However, only certain elementary concepts are used here. Two basic tools are also used in the next two sections: cell decomposition and cycles.
Our goal is to capture the topological features present in the image: connected components and their holes.
For example, in the image on the right there are two objects and the first one has two holes inside it.
The resulting problem is commonly known as "connected component labeling" and has many different solutions. Even though the approach being used is different from those, the output will be the same.
We think of black objects as connected components and white objects as holes in the dark objects. The opposite approach is equally feasible.
We choose the following option:
Binary images are analyzed as if they have black objects on white background.
Consequently, the white objects that touch the border are not counted.
Next, we make it more precise.
A binary image is a rectangle covered by black and white pixels arranged in a grid. In order to study the topology of the image it is reasonable to think of a pixel as a square, or a tile: [n, n + 1] × [m, m + 1].
The union of any collection of pixels is a subset of the Euclidean plane. Therefore it acquires its topology from the plane [12] (see relative topology). In this setting, the concepts of “connected component” and “hole” have the standard meaning.
CELL DECOMPOSITION OF BINARY IMAGES
The boundary of a pixel is the combination of its four edges. Since an edge is shared by two adjacent pixels, keeping the list of these edges is a way to record how pixels are attached to each other. Meanwhile, keeping the list of vertices is a way to record how edges are attached to each other. This is called cell decomposition. The idea of cell decomposition can be traced back to the Euler formula [12].
It is standard in algebraic topology [12], [3] to represent topological spaces as “cell complexes”. This approach has been extensively applied to digital image analysis [11] and geometric modeling [15]. This method of cell decomposition differs in technical details from those that use “darts” [2], [7] (see also [13]).
In the 2-dimensional setting cells are defined as follows:
- a vertex {n}× {m} is a 0-cell,
- an edge {n}× (m, m + 1) is a 1-cell, and
- a face (n, n + 1) × (m, m + 1) is a 2-cell.
Thus cells are “open”. Then, cell decomposition is a partition of the union of black (closed) pixels into the union of a collection of disjointed (open) cells.
The first advantage of this approach is its generality. The pixels are attached to each other along the edges they share:
- a vertex is a 0-cell;
- two adjacent edges are 1-cells and they share a vertex, a 0-cell;
- two adjacent faces are 2-cells and they share an edge, a 1-cell.
This approach is applicable to all dimensions.
Another advantage is related to the desire for the algorithm to be incremental – adding one pixel at a time. As a result, it can be extended to gray scale images and to color images, video, etc.
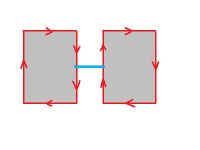
With cell decomposition, when we need to add a pixel to the image, we add its vertices first, then the edges, and finally the face of the pixel itself. This makes re-computing the topology easier than one that adds a whole pixel at once. Indeed, consider the fact that the new pixel is adjacent to 8 other pixels (the 8-connectedness) and these 8 pixels may belong to up to 4 different components. The result is that the number of cases to consider is quite high. Meanwhile, if an edge is added instead, the vertices are already present. The result is that there are only 4 cases to consider. The new edge may:
- link two components to each other on the outside;
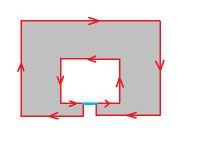
- link a component to another component inside its hole;
- complete a hole in a component, or
- break a hole into two.
The determination of which of these events occurs is based on the local information (below).
The cell decomposition also makes certain geometric concepts more straightforward. First, an object and its background share edges, not pixels. Consequently, the area of a component plus the area of the complement equal the total area of the image. Second, the perimeter is the number of edges, not the number of pixels in its boundary.
At this point we provide a formal definition of the main concept of cell decomposition in dimension 2. Any collection γ of 0-, 1-, and 2-cells is a cell complex provided:
- if γ contains an edge (1-cell) then γ contains its end points (0-cells) as well, and
- if γ contains a face (2-cell) then γ contains its edges (1-cells) as well.
We will refer to the cell complex of the whole rectangle as the carrier.
Notice that a cell complex is allowed to contain vertices and edges that are not parts of faces. The reason for this is the proposed incremental algorithm adds a pixel to the image by adding its vertices, edges, and face (in that order) and it is necessary to treat this collection of cells as a cell complex at every step in the process.
Cell decomposition of the union of black pixels in a binary image produces a cell complex. We will call it the cell complex of the image.
For more see Cell decomposition of images.
USING CYCLES TO CAPTURE TOPOLOGICAL FEATURES IN BINARY IMAGES
Both components and holes are captured by cycles. In a cell complex:
- a 0-cycle is any collection of vertices;
- a 1-cycle is any collection of circular sequences of edges.
Thus a k-cycle is a collection of k-cells [12].
We will concentrate on two special kinds of cycles:
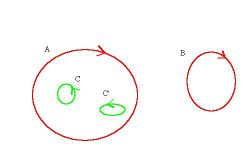
- a 0-cycle that follows the outer boundary of a connected component;
- a 1-cycle that follows the outer boundary of a hole.
We will call them generator cycles. As they are the only ones that will be dealt with, we will refer to them as simply cycles.
Observe that every 0-cycle of this kind can be represented by a 1-cycle, except in the case of a single vertex component. This is the approach we adopt in the following.
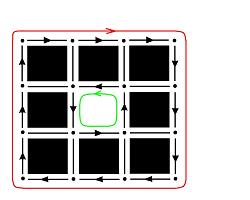
A 0-cycle is traversed clockwise (on the outside of the object like a rubber band) and a 1-cycle is traversed counterclockwise.
Given a cell complex, any cycle can be traversed by taking steps from the initial edge in such a way that black pixels are always on the right and white on the left – until this edge is reached again. This fact is used in the analysis algorithm.
This approach results in a natural and unambiguous representation of the regions – connected components - by means of the curves that enclose them (cf. [16]).
The result of this topological analysis is a partition of the binary image. This partition is a collection of non-overlapping regions, connected sets of black pixels and connected sets of white pixels that covers the whole image. The partition is achieved by finding boundaries of these regions as 0- and 1-cycles.
Knowing the boundaries of the objects allows computation of their areas, moments, centroids, etc via Green’s Theorem.
For more see Cycles and Contours.
A GRAPH REPRESENTATION OF THE TOPOLOGY OF A BINARY IMAGE
First, we consider a graph representation for the topology of a cell complex. It has the following simple structure. Every node represents a cycle. If an object has a hole, there is an arrow connecting these two cycles to indicate the inclusion. For convenience, we add a node for the whole rectangle (carrier). It is a direct successor of all 0-cycles.
This data structure is entirely adequate to capture the topology of the cell complex. Our interest is however the whole binary image. Yet, the graph does not distinguish between an object and an object inside a hole in another object. To capture this information, we put forward a graph representation of the image which is a directed graph with its nodes corresponding to the objects and holes (cycles) in the image and the arrows correspond to inclusions of these sets.
Definition. The nodes of the topology graph of a binary image are the (generator) cycles in the cell complex of the image and the arrows are as follows:
- if an object has a hole, there is an arrow from the latter to the former, and
- if a hole has an object in it, there is an arrow from the latter to the former.
In addition, there is an arrow from every object to the carrier.
Thus, the topology graph captures not only the topology of the cell complex of the image but also the way this complex fits into the complex of the carrier.
Next we outline the algorithm for building the topology graph.
The algorithm is incremental: starting with the empty image, pixels, one by one, are added. Then as the cells of a new pixel are added, the augmented topology graph, or simply the augmented graph, is expanded. As with the topology graph, each node in the augmented graph represents a component or a hole. During this process components merge (arrows meet), holes split (arrows part), etc.
Observe that if one follows this procedure, at every stage the current collection of cells is a cell complex. One of the alternative approaches is to add all vertices first, then all edges, then all faces.
During the construction, the cell complex grows through the following three cell complexes:
- the empty cell complex,
- the cell complex of the image,
- the carrier.
These three cell complexes will be called frames of the image. The frames will play a more prominent role in the case of gray scale images, as there are 255 levels of gray. The cycles/nodes of the frames are called principal cycle/nodes and the rest are auxiliary cycles/nodes. The topology graph can be extracted from the augmented graph by removing all auxiliary nodes and adding arrows between the principal nodes accordingly.
There are two stages in the construction of the augmented graph. First, cells are added to the empty cell complex until the cell complex of the image is reached. In the end of this stage, the graph contains the information about the components and their holes. Second, cells are added to the cell complex of the image until the carrier is reached. In the end of this stage, the graph also contains the information about holes containing components.
Outline of the algorithm:
- All pixels in the image are ordered in such a way that all black pixels come before white ones.
- Following this order, each pixel is processed as follows:
- add its vertices, unless those are already present as parts of other pixels;
- add its edges, unless those are already present as parts of other pixels;
- add the face of the pixel.
- At every step, the augmented graph is given a new node and directed arrows that connect the nodes in order to represent the merging and the splitting of the cycles, as follows:
- adding a new vertex creates a new component in the complex;
- adding a new edge may connect two components, or create, or split a hole;
- adding the face to the hole eliminates the hole.
For more see Topology graph and Algorithm for binary images.
Once the topology graph is constructed, the second, optional, part of the analysis is to filter the principal cycles in order to eliminate noise and irrelevant details. The filtering criteria are based on cycles’ characteristics such as size, location, etc. These criteria should be set in such a way that it once they are removed the result is still a cell complex. For example, it should be impossible to remove an object while preserving a hole in it or vice versa. Removing objects and holes with the area below a given threshold is an example of such a criterion – provided the area is computed as the area inside the corresponding cycle rather than the actual area of the object. Filtering criteria are discussed in more detail in the section devoted to gray scale images, below. The remaining principal cycles represent the simplified topology of the image. We will call them active cycles.
See also Filtering output data.
THE TOPOLOGY OF A GRAY SCALE IMAGE
In a gray scale image every pixel is associated a number indicating the gray level. These numbers run from 0 to L-1, where L is usually 256.
Observe that if L=2 then this is a binary image. Even though topology of binary images is well understood [12], [7], [15], the well known methods are not directly applicable to gray scale images. The analysis presented above however is fully applicable with minor changes, as shown below.
One can think of a gray scale image as a function of two variables defined on a rectangle. The gray level function is a function from [0, N) × [0,M) to the set {0, 1,…, L-1} which is constant on each square [n, n + 1) × [m, m + 1).
Given a number T, thresholding replaces all the pixels with gray level lower than or equal to T with black leaving the rest white.
The output of thresholding is a binary image. However, because of the loss of information during thresholding, this binary image cannot always serve as an adequate replacement of the original gray scale image. Below are two examples of images for which a single threshold wouldn’t work.
First, you see a gray scale image and its gray level function. The gray surrounding the white square on the left is the same as the gray of the square on the right. Therefore no single threshold will capture both squares.
A more realistic example. The gray of the ridges inside the green circle is close to the gray between the ridges inside the red circle. Therefore no single threshold will capture all ridges of this fingerprint.
We justify our approach to analysis of the topology of gray scale images in two ways. First, we appeal to analysis of binary images presented in the previous sections; second to prior research on the subject.
In binary images objects are either connected black areas surrounded by white background or connected white areas surrounded by black background. Similarly, our initial assumption about gray scale images will be that objects are either darker areas surrounded by lighter background or lighter areas surrounded by darker background. We propose the following terminology.
Definition. In a gray scale image,
- a dark object is a connected component of a lower level set of the gray level function; and
- a light object is a connected component of an upper level set of the gray level function that does not touch the border.
The reason for the latter to include the extra restriction is that we want our analysis of gray scale images to match that of binary images. Indeed, in a binary image if a hole touches the border, it’s not a hole.
Our approach is derived from the analysis of binary image but it is also in agreement with the following gestalt principle (Werthheimer’s contrast invariance principle) [6]:
This principle suggests that one should look at the level sets of the gray scale function, as well as lower and upper level sets. A related principle is discussed in [17]:
Our conclusion is that the connected components of the lower and upper level sets of the gray scale function - the objects - should serve as the main building blocks in image segmentation. This conclusion is justified by the analyses conducted in [1], [17].
As the objects are connected collections of pixels they can be represented as 0- and 1-cycles, as before.
Capturing all light and dark objects however does not produce unambiguous results. Let’s consider the image below as an example.
First, a blurred version of the image. Second, each choice of thresholds produces a different topology. First: two dark objects, one with a hole – light object, another light object is a hole in the background. Second: two dark objects, one with two holes – light objects. Third: two dark objects with no holes. Fourth: may seem perfect because it matches the topology of the original binary image.
Indeed, it may seem clear that in the above image there are two objects and the first one has two holes. However, one may choose different thresholds for different level curves. The choice of these thresholds may affect the topology of the resulting image, as illustrated above. All three outcomes are equally valid. This ambiguity has to be resolved in order to be able to compute areas, perimeters, and other geometric characteristics of these objects.
Therefore, the analysis has to include the following two stages:
- Stage 1. Collect all possible objects in all binary images obtained via thresholding for every value of T from 0 to L. We will call these images frames.
- Stage 2. Filter these objects to resolve the ambiguity. The result is the list of active cycles that can be further filtered to remove noise and other irrelevant features.
To ensure that the ambiguity is resolved properly we will adhere to the following “2D uniqueness principle”:
The principle is vacuously true for binary images. For our purposes it is important that this principle guarantees that the active cycles you cross (from inside out or from outside in) will alternate: 0-cycle, 1-cycle, 0-cycle, 1-cycle, etc.
The justification for this principle lies in the fact that in 2D there can be no object in front of or behind another. So, either the larger object is the background for the smaller one or the smaller object is noise over the larger one. An object can have a hole in it however and that hole may contain another object.
In addition to the above principle Stage 2 may include applying the user’s criteria of what is and what is not important in the image. One example is on the right. Here the circle may be noise (small size) or the square may be background (low contrast). Some specific criteria are discussed in later.
The result of the analysis is a special case of image segmentation: the active cycles partition the image into collections of pixels each of which is identified as one of the following:
- a dark object;
- a light object; or
- the background.
This segmentation satisfies the following properties:
- The outside border of a dark object is a 0-cycle. On the outside lies either a light object or the background.
- The outside border of a light object is a 1-cycle. On the outside lies either a dark object or the background.
A GRAPH REPRESENTATION OF THE TOPOLOGY OF A GRAY SCALE IMAGE
The collection of all possible cycles found in a gray scale image is organized in a graph. Its structure is very similar to that of the topology graph of a binary image: the collections of cycles of the L frames are arranged in L layers within the graph. Each of these cycles encircles a dark object or a light object.
Definition. The nodes of the topology graph of a gray scale image correspond to the cycles (light and dark objects) in the frames of the image and the arrows indicate inclusions as follows:
- there is an arrow from every dark (light) object to a dark (light) object that contains it if they correspond to consecutive gray levels;
- there is an arrow from every dark (light) object to a light (dark) object that contains it if they correspond to the same gray level.
It is important to note here that two identical objects may correspond to two different levels of gray and, therefore, may be contained in two consecutive frames. Then, for example, if the gray level of the image is multiplied by 2, the result is that each layer in the graph is duplicated.
Two examples of images and their topology graphs are given below (L=3). The topology graph may be a tree, as in the first image, but generally it isn't, as in the second. First: the objects are: mouth E (black), head B (gray), eyes C and D (white). Second: A is the complement of the face and F is the complement of the mouth.
The proposed algorithm is incremental. The layers are added to the graph one at a time. Each time we increase the threshold for the upper and lower level sets, there are six kinds of events that can (along with their combinations) happen to the connected components of these sets:
- a dark object grows;
- a light object shrinks;
- a dark object appears;
- a dark object forms a hole (a light object) inside;
- two dark objects merge;
- a light object splits.
The last three events change the topology of the image (see Adding pixels). Recorded in the topology graph, these events are the reason why it is not a tree.
Just as with binary images, instead of the topology graph we build the augmented topology graph, or simply the augmented graph, of the image. The growing threshold creates a partial order on the set of pixels. In that order, the pixels are added to the image. The procedure of building this graph with nodes representing cycles is exactly the same as the one for binary images as presented above. The frames generate principal cycles and the rest are auxiliary cycles. The topology graph can be extracted from the augmented graph by removing all auxiliary nodes and adding arrows between the principal nodes accordingly.
Let’s consider an example. Suppose the image consists of two adjacent pixels, black and gray, on white background. Then, the construction of the augmented graph is exactly the same as described above. The topology graph is H → H' → Carrier (L=3).
The algorithm for binary images is the process of adding pixels one by one while keeping track of changes in the topology. The same approach applies to gray scale images. In fact, all pixels in the image are added in either case. The operation of adding a pixel and all functions it calls are exactly the same as in the case of a binary image. The main difference is that there are L+1 frames instead of 3. Below is the only command presented above that has to be changed. For more see Algorithm for grayscale images.
As some of the principal cycles are discarded, the remaining ones will represent the simplified topology of the image. If the uniqueness principle is followed, the output of the filtering step is a certain kind of topological sorting of the graph. Examples of image simplification based on filtering of lower and upper level sets are presented in [17] and [1].
In this particular implementation of the algorithm, the objects are filtered based on their areas: objects with areas smaller than a certain threshold are considered noise. Since we measure the area of the inside the cycle that surrounds the object, it is easy to satisfy the uniqueness principle. Indeed, since every successor of a dark object has greater area, we only need to check object’s direct predecessors. Other measurements that can be used in such a simple fashion are the total intensity, the integrated optical density and similar.
A different kind of measurement that require checking only the direct predecessor of the dark object is contrast, i.e., the difference between the highest gray level adjacent to the object and the lowest gray level within the object (opposite for light objects). Indeed, every successor of a dark object has higher contrast. Notice that the contrast of an object is exactly its persistence [9] with respect to the sequence of frames.
Unlike the contrast, the average contrast can go up and down as we move from a lower level set to the next. Therefore the filtering step cannot be carried out by checking only the direct predecessors and successors, as with the contrast, and a whole graph search may be necessary. Using such measurements as perimeter, roundness and similar may also require a whole graph search.
Objects can be evaluated and filtered based on any combination of their measurements and other characteristics, such as location. Many filtering criteria have been proposed (e.g. [4], [10], [19]). All of them are also applicable to filtering the topology graph.
COMPARISON TO TREE REPRESENTATIONS
Other approaches to graph representation of gray scale images based on the lower and upper level sets have been proposed in [1], [17] (and for 3D simplicial meshes in [5]). Below we compare the topology graph to these two representations. Both are trees.
First consider the method in [17]. The connected components of lower level sets are ordered by inclusion and, therefore, form an inclusion tree. The components of the upper level sets also form an inclusion tree. The difference is that as the threshold grows from 0 to 255, the upper level sets grow while the lower level sets shrink. In either case, there are layers in these inclusion trees corresponding to the gray levels.
This diagram illustrates the lower inclusion tree and the upper inclusion tree. The red are the lower level sets (dark) and the green are the upper level sets (light). In both trees the layers correspond to the levels of gray.
This diagram also illustrates the merged inclusion tree. In this tree there are no layers corresponding to the levels of gray anymore.
The goal is to combine the two trees. The answer suggested in [17] is to consider the tree formed by connected components of the level sets. As components of the levels sets may be seen as the outer boundaries of the components of the lower and upper level sets, they are ordered and the end result is the “merged inclusion tree”.
Because of the way they are merged, the structures of the two inclusion trees are lost. In particular, the lower level sets are mixed with the upper level sets. The gray levels are also mixed. One of the drawbacks of losing this information is that now it is impossible to filter nodes by checking only their direct neighbors. Of course, the algorithm in [17] could be modified to preserve the relations between the lower level sets and the relations between upper level sets. The result would be the topology graph.
In fact, the topology graph can be seen as an alternative way of combining the lower and upper inclusion trees. The latter is turned upside down and attached to the former.
To summarize, the structure of the topology graph of a gray scale image differs from that of the merged inclusion tree in a number of ways:
- The lower and upper inclusion trees remain intact within the graph.
- The graph breaks into layers that coincide with of the topology graphs of the corresponding frames.
- The topology graph is not a tree in general.
In [1], the tree structure appears as morphological openings and closings of larger and larger scale are applied to the image. In other words, the minima and maxima of the gray scale function are flattened – slice by slice. The result is a combined hierarchy of lower and upper level sets that is recorded as a “scale tree”. An image and its scale tree on the right.
For more see Tree representation of images.
COMPLEXITY OF THE ALGORITHM
Suppose N is the number of pixels in the image.
The memory usage is O(N). Indeed, there are two main data structures: cycles and edges. As adding a pixel creates no more than 9 nodes in the augmented graph, there are O(N) cycles. There are also O(N) edges in the image.
During the construction of the topology graph, each of the N pixels is processed separately and each time at most 9 new objects are created. The edges of the boundaries of some of these objects are marked, which can be done in O(N). Therefore, the complexity of this part of the algorithm is at most O(N2).
Consider the image on the right. Left: the “comb”. Its perimeter is O(N). Right: one of its lower level sets. As we go through the levels of gray in the image in Figure on the right, the objects grow and fill the image. The boundary of each has to be traversed. Therefore the total number of edges to be visited is, roughly, 1 + 2 + 3 + … + N, which adds up to O(N2). Therefore, the complexity of the algorithm is O(N2).
Such an image may seem unusual but images of maps and microchips may fall into this category. Images of cells or other particles do not.
Suppose the image on the right is not quantized. Then the above analysis of the complexity of the algorithm applies to any other algorithm that traces all level sets in the image. This is the case with the “fast level line transform” [17] (step 4a). Therefore its complexity is O(N2), not O(N logN) as claimed.
Regardless of the design of the algorithm, tracing the level sets is necessary in order to compute the perimeters of lower and upper level sets, or their major and minor axes, etc. Only then their shapes can be evaluated.
The complexity of filtering the graph based on area or contrast is O(N) because only the immediate neighbors have to be examined.
The algorithm was implemented under the name Pixcavator and was tested with a variety of images. The processing included:
- constructing the topology graph;
- computing various measurements of all objects;
- filtering the objects based on these measurements and user’s settings.
The processing takes approximately 40 seconds for each million pixels in the image. The results suggest that the proposed algorithm is fast enough for real life applications.
For more see Processing time.
The performance of the algorithm presented here is sacrificed for the sake of simplicity. One can expect that faster algorithms will be developed.
EXPERIMENTS
To further demonstrate the practicality of the algorithm, we analyze a few simple images.
During processing, the areas, perimeters, and contrasts of the objects are also computed. These parameters are used to filter objects. The user indicates ranges of parameters of the features he considers to be irrelevant or noise. The settings may be chosen based on a priori knowledge about the image. For example, the image in Figure 29 is 300 × 246. To capture the coins and ignore the noise and the small features depicted on the coins, one sets the lower limit for the area at 1000 pixels.
A good test of robustness of an image analysis method is the degree of its stability under rotations. The output for the original 640 × 480 fingerprint in Figure 32 is 3121 dark and 1635 light objects. For the rotated version, it is 2969-1617. The errors are about 5% and 1%. By limiting the analysis to objects with area above 50 pixels, the results are improved to 265-125 and 259-124, respectively (2% and 1%). This test shows that even though the algorithm is sensitive (as is the image itself) to rotations, the error is reasonable and decreases if we limit the count to larger objects.
Stretching the image does not affect the count of objects. Shrinking makes objects merge. If the goal, however, is to count and analyze larger features, limited shrinking of the image does not affect the outcome. The count is also stable under noise and blurring.
The method works best with images that represent something 2-dimensional. It is not applicable to the images for which the third dimension is essential. For example, the method fails when the image contains: occluded objects, transparent objects, objects well lit on one side and dark on the other. The method does not incorporate any morphological operations. As a result, scratches can’t be repaired or clustered cells can’t be separated unless there is a variation of intensity.
For more see Examples of image analysis.
The future directions are color image analysis and 3D image analysis via Homology theory.
REFERENCES
- [1] Bangham, J. A., Hidalgo, J. R., Harvey, R., and Cawley, G. C., “The segmentation of images via scale-space trees”, British Machine Vision Conference, 33-43 (1998).
- [2] Bertrand, Y., Fiorio, C., and Pennaneach, Y., “Border map: a topological representation for nD image analysis”, 8th International Conference on Discrete Geometry for Computer Imagery (DGCI'1999), Marne-la-Vallée, France, Springer, Lecture Notes in Computer Science 1568, 242-257 (1999).
- [3] Bredon, G., Topology and Geometry, Springer (1993).
- [4] Breen, E. J. and Jones, R., “Attribute openings, thinnings, and granulometries”, Computer Vision and Image Understanding 64 (3), 377-389 (1996).
- [5] Carr, H., Snoeyink, J., and Axen, U., “Computing contour trees in all dimensions”, Computational Geometry 24, 75-94 (2003).
- [6] Desolneux, A., Moisan, L., and Morel, J.-M., From Gestalt Theory to Image Analysis, A Probabilistic Approach, Springer (2007).
- [7] Damiand, G., Bertrand, Y., Fiorio, C., “Topological model for two-dimensional image representation: definition and optimal extraction algorithm”, Computer Vision and Image Understanding 93 (2), 111-154 (2004).
- [8] Dieudonne, J., A History of Algebraic and Differential Topology, 1900-1960, Birkhäuser Boston (1989).
- [9] Edelsbrunner, H., Letscher, D., and Zomorodian, A., “Topological persistence and simplification”, Discrete Comput. Geom. 28, 511-533 (2002).
- [10] Jones, R., “Connected filtering and segmentation using component trees”, Computer Vision and Image Understanding 75 (3), 215-228 (1999).
- [11] Kaczynski, T., Mischaikow, K., and Mrozek, M., Computational Homology, Springer (2004).
- [12] Kinsey, L. C., Topology of Surfaces, Springer (1997).
- [13] Klette, R. and Rosenfeld, A., Digital Geometry, Morgan Kaufmann (2004).
- [14] Kundu, S., “Peak-tree: a new approach to image simplification”, Proc. SPIE Vision Geometry VIII, 3811, 284-294 (1999).
- [15] Lienhardt, P., “Topological models for boundary representation: a comparison with n-dimensional generalized maps”, Computer-Aided Design 23 (1), 59-82 (1991).
- [16] Malgouyres, R. and More, M., “On the computational complexity of reachability in 2D binary images and some basic problems of 2D digital topology”, Theoretical Computer Science 283 (1), 67-108 (2002).
- [17] Monasse, P. and Guichard, F., “Fast computation of a contrast invariant image representation”, IEEE Transactions on Image Processing 9 (5), 860–872 (2000).
- [18] Najman, L. and Couprie, M., “Building the component tree in quasi-linear time”, IEEE Transactions on Image Processing 15 (11), 3531-3539 (2006).
- [19] Salembier, P., Oliveras, A. and Garrido, L., “Antiextensive connected operators for image and sequence processing”, IEEE Transactions on Image Processing 7 (4), 555-570 (1998).
- [20] Salembier, P. and Serra, J., “Flat zones filtering, connected operators, and filters by reconstruction”, IEEE Transactions on Image Processing 4 (8), 1153-1160 (1995).
- [21] Saveliev, P., “Topology based method of segmentation of gray scale images”, International Conference on Image Processing, Computer Vision, and Pattern Recognition, 620-626 (2009).


