This site is being phased out.
The topology of a binary image
Contents
What we want to get from the image
We approach computer vision from the following direction.
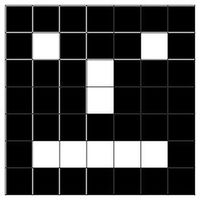
The task is very simple. Consider the image below.
We would like the computer to see what we see - a bunch of black "objects" on white background. We also would like these objects measured and their locations found. And we want these objects captured – pixel-wise -- so that we can deal with them as separate entities.
Our goal is to capture the topological features present in the image:
- "objects", aka connected components and
- holes in them.
For example, in the image below there are two components and the first one has two holes in it.
Now the "objects" are identified:
The problem is commonly known as "connected component labeling" and has many different approaches. We consider just one.
One can think of black objects as connected components and white objects as holes in the dark objects but the opposite approach is equally feasible. We choose the former option:
Consequently, the white objects that touch the border are not counted.
The background in topology as it applies to analysis of binary images is discussed below.
The first tool is cell decomposition: the image is represented as a combination of pixels as well as edges and vertices.
The second tool is cycles. Both the connected components and the holes are captured by circular sequences of edges.
The resulting data structure – the "topology graph" – for the hierarchy of objects and holes is constructed. The algorithm for the construction of the topology graph is incremental – every time a pixel is added, the topology of the resulting binary image is re-computed.
Using cycles to partition the image
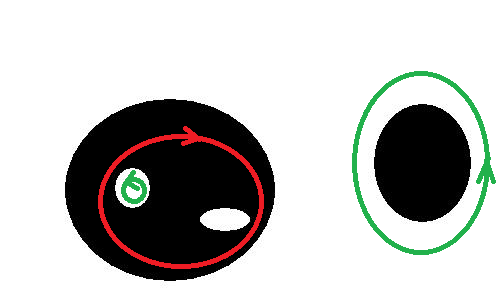
Both objects/components and holes can be captured by cycles:
- A $0$-cycle follows the outer boundary of an object (like a rubber band),
- A $1$-cycle follows the outer boundary of a hole.
(The terminology will be explained later.)
The idea is to represent the topological features of the image by means of these cycles.
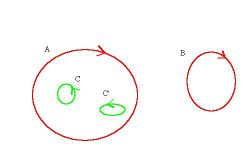
Below $A$ and $B$ are $0$-cycles, $C$ and $C’$ are $1$-cycles.
This results in a natural and unambiguous representation of the regions by the curves that enclose them:
- A $0$-cycle is traversed clockwise.
- A $1$-cycle is traversed counterclockwise.
Observe that in the either case black is on the right.
Given an image, any cycle can be traversed by taking left turns from the initial edge in such a way that black pixels are always on the right - until this edge is reached again.
Note: This does not work in 3D, at all. Dealing with tunnels would require homology theory anyway.
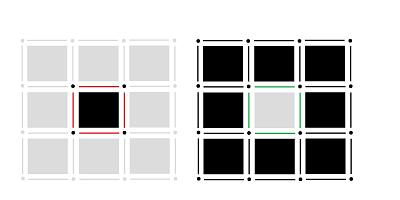
Of course, $1$-cycles of the picture are $0$-cycles of its negative and vice versa, except for ones that touch the border of the image.
This is just the idea...
From both practical and theoretical points of view, it's beneficial to consider a broader concept of cycles, as follows:
- a $0$-cycle is a closed curve traversed clockwise within the black.
- a $1$-cycle is is a closed curve traversed counterclockwise within the white.
Both types of cycles are allowed to exist within
- the boundary between black and white, as well as
- the border region of the image is allowed too.
Cycles in cubical complexes
The cell decomposition of images has given us a cubical complex. In such a representation we can only use combinations of cells to capture these features. So, we choose the following:
We will concentrate on two special kinds of cycles:
- a $0$-cycle that follows the outer boundary of a connected component;
- a $1$-cycle that follows the outer boundary of a hole.
We will call them generator cycles. As they are the only ones that will be dealt with, we will refer to them as simply cycles.
Exercise. Follow the above idea to come up with an economical way of capturing cycles.
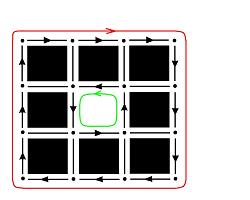
The result of this topological analysis is a partition of the binary image. The partition is a collection of non-overlapping regions, connected sets of black pixels and connected sets of white pixels, that covers the whole image. The partition is achieved by finding boundaries of these regions as $0$- and $1$-cycles. These cycles are closed curves made of vertical and horizontal edges of pixels. Here's another example of how cycles partition an image.
Given a cubical complex, any cycle can be traversed by taking steps from the initial edge in such a way that black pixels are always on the right and white on the left – until this edge is reached again. This fact is used in the analysis algorithm.
Knowing the boundaries of the objects allows computation of their areas, moments, centroids, etc via Green's Theorem.
About the terminology... The name “$1$-cycle” is justified by the fact that this is a sequence of edges or $1$-cells. But so is a $0$-cycle. How come? The representation is only a matter of convenience. A $0$-cycle can just as easily be represented as a sequence of $0$-cells (in fact a single vertex will suffice). This way we would have a unified approach:
- a $0$-cycle is any collection of vertices;
- a $1$-cycle is any collection of circular sequences of edges.
So, a $k$-cycle is a collection of k-cells. This idea works in all dimensions. In fact, we can connect this treatment of cycles to that of homology theory. We simply observe that the contour that represents a $0$-cycle in an image $M$ is, in fact, a $1$-cycle of the closure of the complement of $M$. This is an instance of the Alexander duality.
A graph representation of the topology of a binary image
We start by presenting a graph representation for the topology of any cubical complex.
This graph has the following simple structure. Every node represents a cycle. If an object has a hole, there is an arrow connecting these two cycles to indicate the inclusion. For convenience, we add a node for the whole rectangle (carrier). It is a direct successor of all $0$-cycles.
This data structure is entirely adequate to capture the topology of the cubical complex. Our interest is however the whole binary image. Yet, the graph does not distinguish between an object and an object inside a hole in another object. To capture this information, we put forward a graph representation of the image which is a directed graph with its nodes corresponding to the objects and holes (cycles) in the image and the arrows correspond to inclusions of these sets.
Definition. The nodes of the topology graph of a binary image are the (generator) cycles in the cubical complex of the image and the arrows are as follows:
- if an object has a hole, there is an arrow from the latter to the former, and
- if a hole has an object in it, there is an arrow from the latter to the former.
In addition, there is an arrow from every object to the carrier.
Thus, the topology graph captures not only the topology of the cell complex of the image but also the way this complex fits into the complex of the carrier.
Exercise. Draw the topology graph of the "figure eight".
Exercise. Draw the topology graph of the white "figure eight" on the black background.
The algorithm
Next we outline the algorithm for building the topology graph.
The algorithm is incremental: starting with the empty image, pixels, one by one, are added. Then as the cells of a new pixel are added, the augmented topology graph, or simply the augmented graph, is expanded. As with the topology graph, each node in the augmented graph represents a component or a hole. During this process components merge (arrows meet), holes split (arrows part), etc.
Observe that if one follows this procedure, at every stage the current collection of cells is a cubical complex.
Note: One of the alternative approaches is to add all vertices first, then all edges, then all faces.
During the construction, the cubical complex grows through the following three cubical complexes:
- the empty cubical complex,
- the cubical complex of the image,
- the carrier.
These three complexes will be called the frames of the image. (The frames will play a more prominent role in the study of the topology of gray scale images, as there are $255$ levels of gray.) The cycles/nodes of the frames are called principal cycle/nodes and the rest are auxiliary cycles/nodes. The topology graph can be extracted from the augmented graph by removing all auxiliary nodes and adding arrows between the principal nodes accordingly.
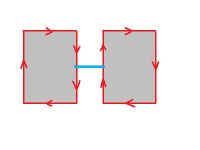
Case (a) - the new edge connects two different $0$-cycles:
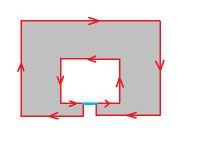
Case (b) - the new edge connects a $0$-cycle to itself:
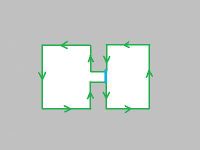
Case (c) - the new edge connects a $1$-cycle to itself:
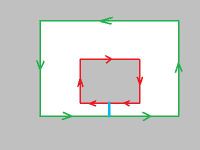
Case (d) - the new edge connects a $1$-cycle to a $0$-cycle (inside):
There are two stages in the construction of the augmented graph. First, cells are added to the empty cubical complex until the cubical complex of the image is reached. In the end of this stage, the graph contains the information about the components and their holes. Second, cells are added to the cubical complex of the image until the carrier is reached. In the end of this stage, the graph also contains the information about holes containing components.
Outline of the algorithm:
- All pixels in the image are ordered in such a way that all black pixels come before white ones.
- Following this order, each pixel is processed as follows:
- add its vertices, unless those are already present as parts of other pixels;
- add its edges, unless those are already present as parts of other pixels;
- add the face of the pixel.
- At every step, the augmented graph is given a new node and directed arrows that connect the nodes in order to represent the merging and the splitting of the cycles, as follows:
- adding a new vertex creates a new component in the complex;
- adding a new edge may connect two components, or create, or split a hole;
- adding the face to the hole eliminates the hole.
Once the topology graph is constructed, the second, optional, part of the analysis is to filter the principal cycles in order to eliminate noise and irrelevant details.
The filtering criteria are based on cycles’ characteristics such as size, location, etc. These criteria should be set in such a way that it once they are removed the result is still a cell complex. For example, it should be impossible to remove an object while preserving a hole in it or vice versa. Removing objects and holes with the area below a given threshold is an example of such a criterion – provided the area is computed as the area inside the corresponding cycle rather than the actual black (or white) area. The remaining principal cycles represent the simplified topology of the image.
An alternative way of capturing the topology of a cubical complex is via its boundary operator.
Examples
The image is built pixel by pixel. As it happens, the changes in topology of the current cubical complex are being tracked. The steps and the changing topology are recorded in a graph, the topology graph.
Suppose we want to add a single pixel to a black image.
How the graph is created is illustrated here.
Adding a stand-alone pixel requires $9$ steps: adding $4$ vertices, $4$ edges, and the cell itself:
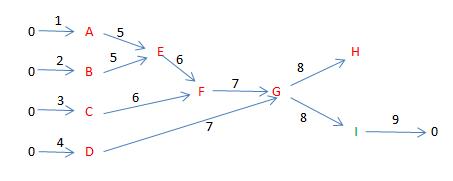
It takes $9$ steps corresponding to the $9$ items added to the image. The arrows correspond to merging and splitting of cycles. The arrows are accompanied by numbers indicating which items is being added. For convenience the procedure is broken into $4$ stages. There are four pictures and a graph with $4$ “layers” corresponding to these stages.
Based on the cell decomposition of images vertices and edges are also added. Generally, adding a new vertex creates a new component and a new node in the graph. Adding a new edge either connects two components or creates a hole in an existing component. Adding the cell itself eliminates a $1$-cycle.
Let's consider the steps. The pixel consists of $9$ parts numbered as follows:
- vertices: $1-4$,
- edges: $5-8$,
- pixel itself: $9$.
They are added in this order illustrated below (stages 1 - 4):
- Stage 1: $4$ vertices (1-4) are added and exist as separate $0$-cycles, $A, B, C, D$.
- Stage 2: as we add the first edge (5) two of these cycles ($1$ and $2$) merge into one, $E$. As we add the next edge (6), the third $0$-cycle (3) joins them, $F$. Adding the third edge (7) merges vertex (4) with the rest. At this point all we have is a single $0$-cycle, $G$.
- Stage 3: adding the fourth edge (8) changes the $0$-cycle, $H$, and creates a $1$-cycle, $I$.
- Stage 4: adding the cell itself (9) eliminates cycle $I$.
A graph representation of the $4$ stages ($9$ steps) of adding a stand-alone pixel:
Since two vertices and one edge are already present, adding a second pixel requires only $6$ steps: adding $2$ vertices, $3$ edges, and the cell itself:
A graph representation of the $6$ steps of adding a second pixel:
In the image below, adding 1st pixel takes $9$ steps, $2-6$th $6$ steps each, $7$th $5$ steps, and $8$th $4$ steps.
If we omit the intermediate steps of adding edges and vertices, the graph looks much simpler. Here is an example: $8$ pixels arranged in a square. The pixels, $1-8$, are added one by one. After the first one there are no new cycles until pixel $7$ which creates a new $1$-cycle.
Exercise: Plot the graph for this image below. Answer
Exercise: This order is possible: vertex, vertex, edge, vertex, edge, vertex, edge, edge, pixel. Plot the graph. Answer
