This site is being phased out.
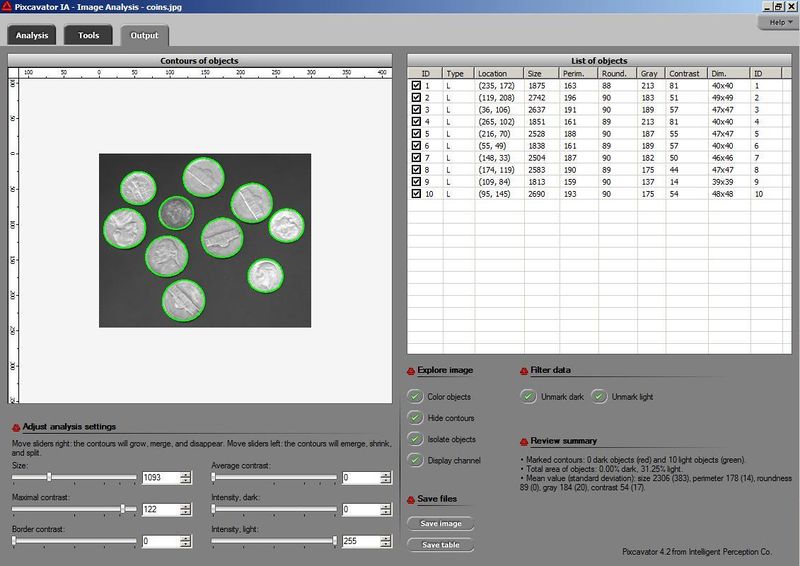
Pixcavator's output table
Pixcavator's analysis of the image generates the following data. This is a spreadsheet type table containing all objects in the image satisfying the analysis settings.
The columns are:
- ID: the ID of the object, the order in which they are found (no special meaning),
- Type: L for light or D for dark, see Objects in gray scale images,
- LocationX and LocationY: coordinates of the centroid of the object,
- Size: the number of pixels inside the contour of the object = area,
- Perim.: perimeter of the object = the length of the contour,
- Round.: roundness of the object,
- Gray: the average gray level inside the contour = average intensity,
- Contrast: the average contrast of what's inside the contour relative to the border,
- Thick. andLength: the dimensions of the object = thickness and length.
- ID: repeated for your convenience
The number of rows in the table is currently limited to 2000.
The table appears in many screenshots in image analysis examples as well as specifically in these:
- Measuring electronic components
- Testing vaccine spray/aerosol droplets
- Counting fixed and live red blood cells
- Measuring a needle
For more examples see Image statistics.
For more on nature of these parameters and for examples on how to use these parameters see Measuring objects and Computation error.
The table, combined with the settings, statistical summary etc, can be saved to hard disk in the form of a spreadsheet by pushing Save table. The result is a complete report of the image analysis.
