This site is being phased out.
Immunohistochemistry on lung biopsies
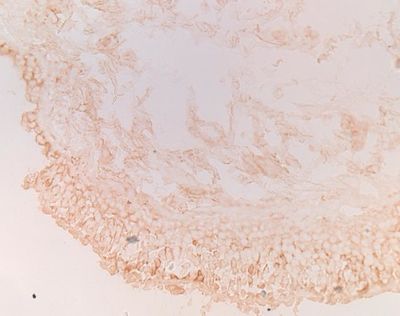
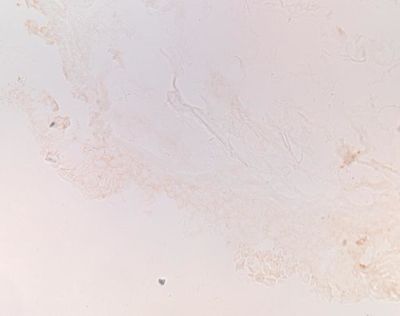
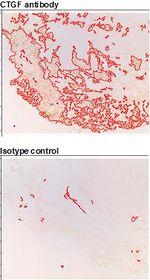
Q: "Immunohistochemistry was performed on my lung biopsies and now I have to analyse my staining. I would like to get a value for the colour intensity of my staining. ... In the output of Pixcavator a mean value for grayness is given, but I don't think all my brown staining is measured. Even if I adjust the threshold for size, not all objects are captured with a red or green contour. ... I tried to compare images of lung biopsies stained with antibody and isotype control. Although you can see a distinct difference between the images, the values for grayness are almost the same. Can the mean value for grayness reflect this difference in colour intensity or is it not possible? "
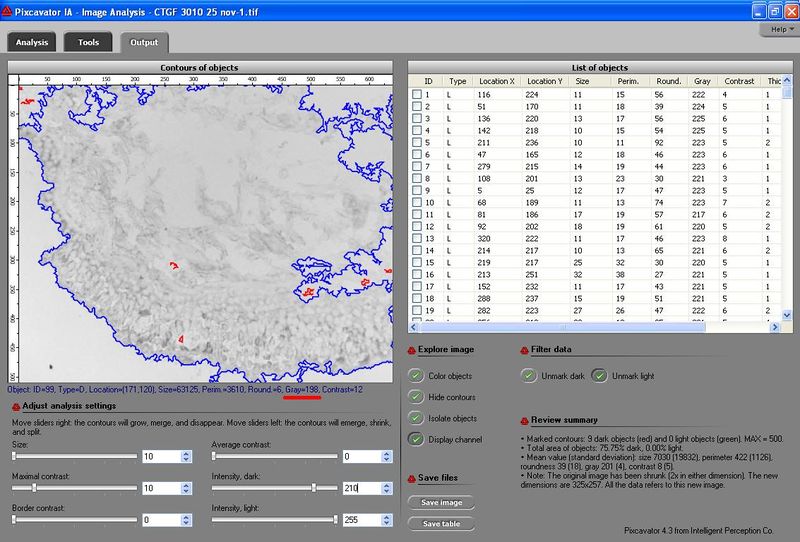
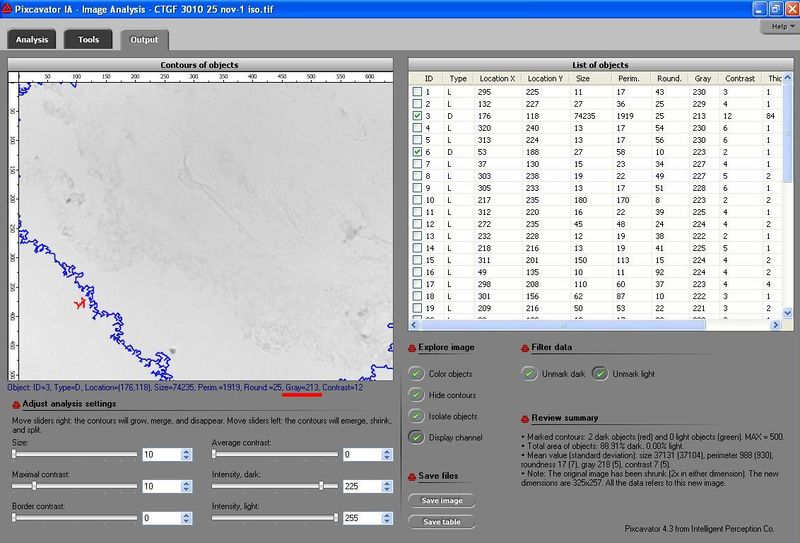
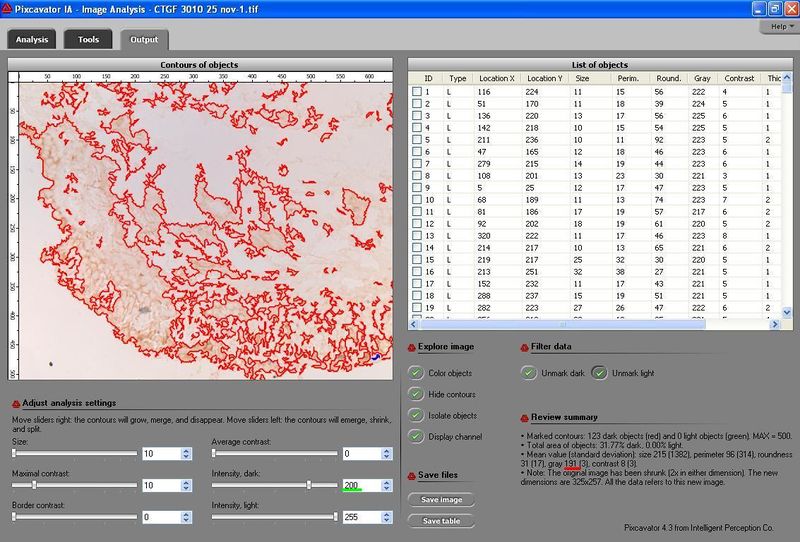
1. The difference in gray isn't more pronounced because what is displayed is the average not the weighted average. So, one large, darker object is outweighed by smaller, lighter ones. If you hover over objects (or look at the table) one at a time, you see a more noticeable difference. You can also save the data as a spreadsheet and compute the weighted averages. Certainly, if the difference is still too small, contrast enhancement would help.
2. It's better to choose the green channel (or blue) than red. The features are much more distinct. If you click on "Display channel", you'll see the difference.
3. You are interested in dark objects only, red contours. So, the light ones only skew the averages. Click "Unmark light".
4. The "Size" slider does not seem to reveal the features quite well. I used the simple thresholding instead, i.e., the "Intensity, dark" slider.
Three screenshots of these microscopy images are below. (This example may be somewhat similar: Measuring staining in the liver.)
Comparison is another issue. It is important to remember that if you choose the same settings for the two images, there will be hardly any difference in gray value between the objects in the two images (on the right). This isn't surprising - you choose dark objects in the first image and in the second with the exactly the same degree of darkness! That's why you have much fewer objects in the second image but the average darkness is the same. Instead you have to find new settings for the second image that capture the features as well as in the first. The gray will be much lower.
Using the weighted average to capture the difference in color would still be a better choice but you'd have to use Excel for that. This is how. I edited the Excel spreadsheet produced by Pixcavator (it looks different in the current version as a report). Here, the last column is the average gray times the area (as the weight). Incidentally, the result is what we call "saliency". At the bottom I added all up and divided by the sum of the areas. That gives the average gray level of the whole collection of contours. The result is 191 which is reasonable.
